Applitools Eyes gives you comprehensive visual coverage over thousands of components with practically a single command: npx -y @applitools/eyes-storybook. It feels like magic—near-zero effort for 100% visual confidence across your entire UI library.
Because onboarding is so seamless, new customers, or new teams adopting Applitools within an organization, often integrate massive, existing design systems from day one. You run that single command, and suddenly, thousands of components are flowing into the Applitools Test Manager.
While the setup is instant, rendering that sheer volume of components on a standard CI runner can introduce growing pains, such as CI timeouts, memory limits, or sluggish pipelines. The good news? With a small, one-time investment in your CI architecture, you can unlock blazing-fast runs. Here is how to optimize your high-volume visual testing pipeline so you can reap the massive ROI of complete automated visual coverage.
The Concurrency Trap (And Why “More Tabs” Isn’t the Answer)
When aiming to speed up test execution, increasing the number of concurrent browser tabs on a single machine might seem like a logical step. Internally, this concurrent rendering behavior is governed by an environment variable called APPLITOOLS_CONCURRENT_TABS.
However, scaling up concurrency on a single CI runner has strict hardware limits. Each additional browser instance spawned during the run consumes dedicated memory and CPU resources. Exceeding the machine’s physical capacity forces the operating system into heavy context-switching between processes. Ultimately, this resource contention degrades performance, increases overall execution time, and frequently results in out-of-memory errors or unexpected CI crashes. For high-volume test suites, increasing the tab concurrency on a single machine is counterproductive.
The Architectural Solution: CI Sharding
To handle thousands of visual tests seamlessly, we must shift from brute-force concurrency to intelligent workload distribution. We highly recommend Sharding, distributing the test load across multiple parallel CI runners.
Instead of asking one machine to sweat through 4,000 components, you spin up 20 parallel machines, each gracefully handling just 200 components in a fraction of the time. For example, a Storybook with 100 stories taking 10 minutes can complete in approximately 2.5 minutes when split across 4 shards running in parallel.
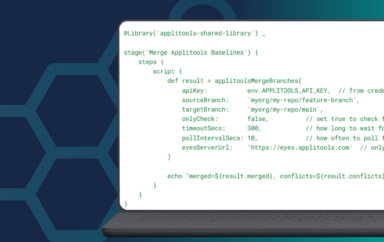
Here is an elegant way to achieve this using a GitHub Actions matrix strategy combined with the standard Applitools CLI:
test-with-sharding:
    runs-on: ubuntu-latest
    strategy:
      matrix:
        shard: [1, 2, 3, 4]
        total: [4]
    steps:
      - uses: actions/checkout@v4
      - name: Setup Node.js
        uses: actions/setup-node@v4
        with:
          node-version: '20'

      - name: Create sharding config
        run: |
          echo "module.exports = { include: ({index}) => index % ${{ matrix.total }} + 1 === ${{ matrix.shard }} };" > applitools.config.js

      - name: Run sharded tests
        env:
          APPLITOOLS_API_KEY: ${{ secrets.APPLITOOLS_API_KEY }}
          APPLITOOLS_BATCH_ID: ${{ github.event.pull_request.head.sha || github.sha }}
        run: npx eyes-storybook -f ./applitools.config.js
How it works: The script dynamically generates an applitools.config.js file that uses a modulo operation to filter which stories run on which machine. All shards run simultaneously, utilizing standard npm commands, dramatically reducing total execution time.
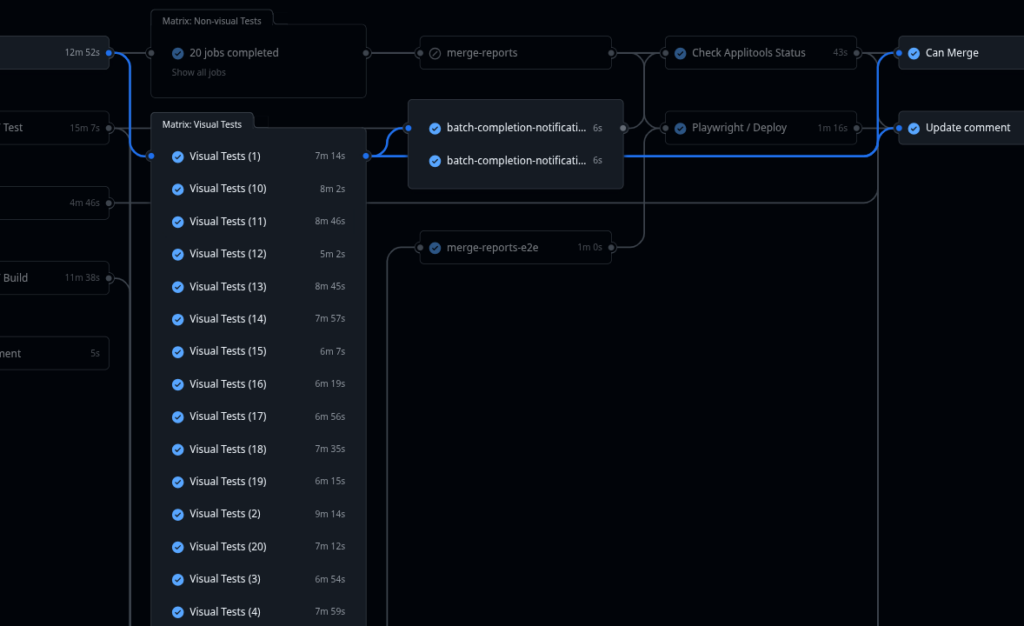
This is also how we’re using it internally (we’re using Applitools Eyes to test all of our products):
⚠️ The Golden Rule of Sharding: Consistent Batch IDs
If you implement sharding, there is one absolute rule: Every single shard must use the exact same APPLITOOLS_BATCH_ID (as shown in the env block above).
If you don’t keep the Batch ID constant across all parallel jobs, your test results will fragment into dozens of separate batches in the Applitools Dashboard. Sharing the same Batch ID ensures that all the shards seamlessly stitch their results together into one unified batch.
Tying It Together: Batch Completion Notification
Sharding solves performance, but it introduces a new architectural requirement. By default, the Applitools GitHub Integration automatically closes a batch when a CI build operation completes. However, when you run concurrent shards on the same commit, you must disable automated batch closing via the Applitools Test Manager (under Admin > Teams > Integrations > GitHub > Manage repositories).
Why? Because Applitools needs a definitive “green light” that all shards have finished before it can update your Source Control Management (SCM) integrations. If you rely on GitHub Pull Request checks or Slack alerts, the backend must wait for the entire distributed suite to finish.
The Solution: Add a final, dependent job in your CI pipeline that triggers only after all your shards have completed. This job notifies the Applitools API to formally close the batch:
  batch-completion-notification-storybook:
    needs: test-with-sharding
    if: always()
    runs-on: ubuntu-latest
    env:
      APPLITOOLS_BATCH_ID: ${{ github.event.pull_request.head.sha || github.sha }}
      APPLITOOLS_API_KEY_ENV: ${{ secrets.APPLITOOLS_API_KEY }}
    steps:
      - name: Update Applitools batch status
        run: |
          curl -X POST -d "" -H "accept:*/*" "https://eyesapi.applitools.com/api/externals/github/servers/github.com/commit/${{env.APPLITOOLS_BATCH_ID}}/complete?apiKey=${{env.APPLITOOLS_API_KEY_ENV}}"
Under the Hood: Advanced & Experimental Flags
If you have implemented sharding and still want to shave precious seconds off your execution time, the Applitools SDK offers a few advanced configuration flags.
storyDataGap: This parameter intelligently manages the queue of components waiting to be rendered. Tweaking this value (e.g., setting it to 250 or 400) smooths out sudden load spikes, preventing the client from overwhelming the network.navigationWaitUntil: By default, the browser waits for the load event before taking a snapshot. You can optionally change this todomcontentloaded. This allows the snapshot to trigger significantly faster, but carries a risk: if your application uses deferred scripts that inject images or content after the initial DOM loads, taking the snapshot too early might result in missing assets and false-positive regressionsbrowserCacheRequests(Experimental): This undocumented flag forces the browser to cache responses and assets across navigations by interacting directly with the Chrome DevTools Protocol (CDP). While it drastically cuts down network overhead for shared assets, it is highly experimental and comes with the risk of pulling stale assets from the cache.
A Note on Experimental Features: Some of these flags bypass standard browser behaviors or are subject to change and could be removed in future versions. Use them with care and test them against your architecture to avoid visual regressions.
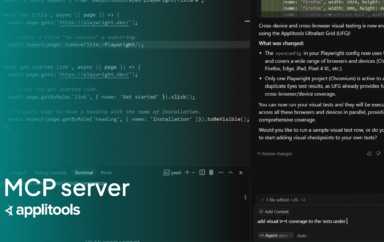
Bonus: Shifting Left with the Applitools Storybook Addon
While CI sharding handles your high-volume pipeline, local development requires a faster, more targeted approach. For rapid, day-to-day feedback, the Applitools Eyes addon for Storybook integrates directly into your local Storybook UI. It allows developers to run tests, view diffs, and approve changes without leaving the component explorer—acting as the perfect “shift left” companion to catch visual bugs before they ever reach your sharded CI runs.
Conclusion
Integrating eyes-storybook gives your team superpower-level visual coverage in seconds. When applied at an enterprise scale across thousands of components, stepping away from single-machine concurrency in favor of CI Sharding ensures your tests run exactly as they should: fast, stable, and reliable.
By enforcing a constant Batch ID and managing your Batch Completion Notifications, you create a highly resilient testing pipeline. The ROI is immense: perfect visual confidence across your entire design system, without ever slowing down your release cycle.
Quick Answers
Vertical scaling—such as increasing the APPLITOOLS_CONCURRENT_TABS environment variable—is strictly bound by the physical CPU and memory limits of a single CI runner. You should transition to horizontal scaling (sharding) the moment your test suite outgrows those limits and you start noticing diminishing returns, such as out-of-memory errors, increased context-switching overhead, or frequent timeouts. Sharding distributes the load across multiple independent machines, giving you virtually limitless scaling capacity and dramatically faster execution times.
When you shard tests, GitHub Actions runs them as separate, parallel jobs. Because these jobs are technically independent, the Applitools backend doesn’t know when the entire suite is finished. The Batch Completion Notification job acts as a final handshake, explicitly telling the Applitools API that all shards are done, which ensures your CI status checks (like Pull Request status or Slack alerts) are triggered only once all tests have successfully reported.
This is a core advantage of the Applitools Ultrafast Grid. When you run your tests, Applitools doesn’t just take a simple screenshot. It extracts your component’s DOM and assets once, and then renders that exact state across a vast matrix of different browsers, viewports, and operating systems concurrently in the cloud. (You can define this matrix in your applitools.config.js file—see more details.) This means a single Storybook component can instantly generate dozens of tests, ensuring massive cross-browser visual coverage without adding any extra rendering overhead to your CI machine.